
Cut software spend.Pay only when it works.
OpExRadar shows finance leaders at 1,000–10,000 employee companies exactly where operating spend is wasted — unused licences, overlapping tools, renewals nobody owns — and quantifies every euro. You pay a share of what we help you save.
NO CURE. NO PAY.
You only pay when we deliver a successful result. No result, no fee.
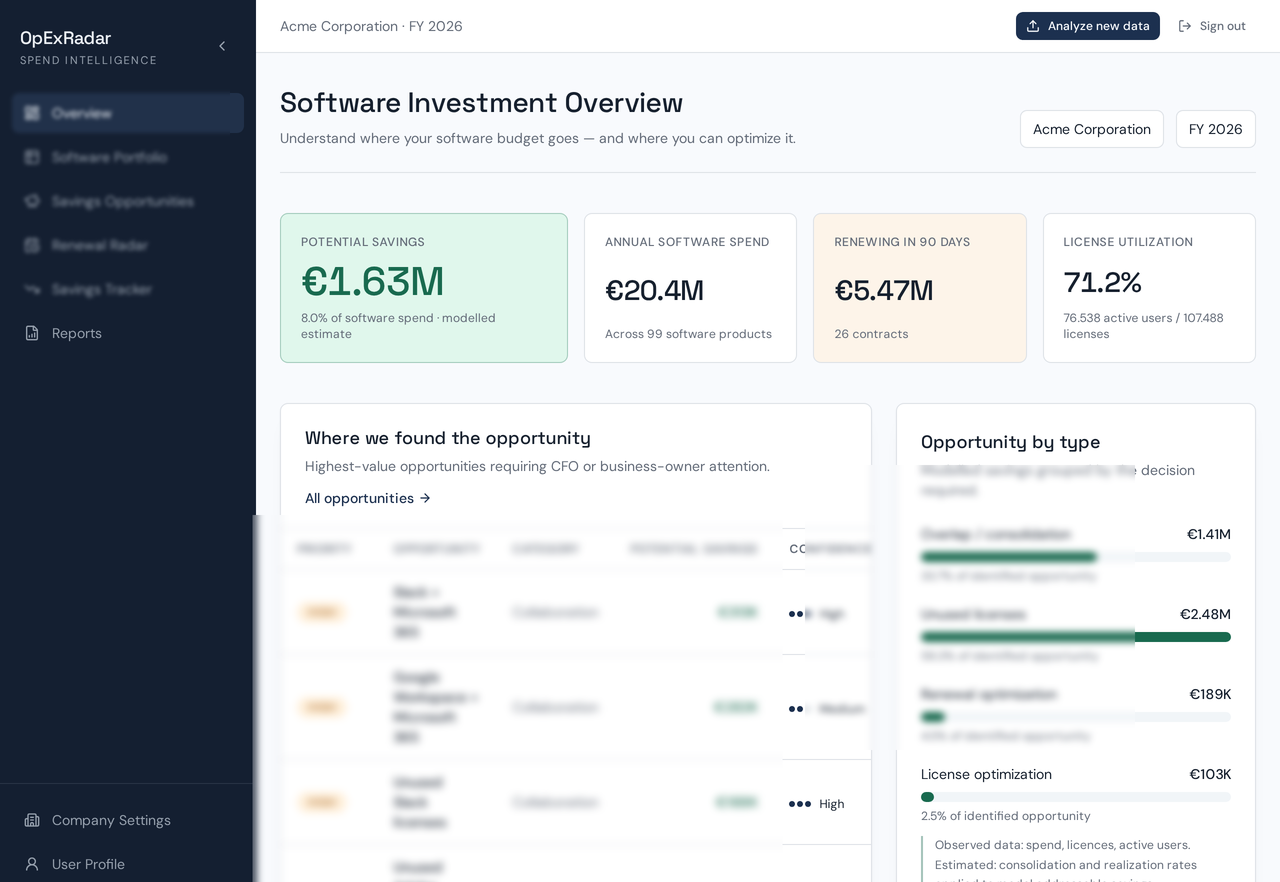
Addressable savings, reference portfolio
€1.63M
Built for the portfolios finance teams actually manage


Logos shown to illustrate a typical enterprise software portfolio, not customer endorsements.
We turn scattered spend data into decisions you can sign off
One reconciled record of operating expenditure, with the waste priced and the evidence attached.
One view of every euro
Spend, licences, utilisation and contract dates from every business unit, reconciled into a single record.
99
products reconciled in the reference portfolio
Waste, quantified
Unused seats and overlapping tools priced in euros, ranked so the biggest decisions reach you first.
8.0%
of annual software budget identified as addressable
Renewals under control
Every expiry, notice period and exposure figure in one calendar, so no contract renews by accident.
€4.9M
renewal exposure visible in the next 12 months
Numbers you can defend
Each figure shows its inputs, formula and confidence level — ready for the audit committee.
100%
of savings figures traceable to a deterministic formula

We only win when you win
Most spend-analysis tools invoice you whether or not anything changes. We do the opposite: our fee is a share of the savings you realise, measured in your own data.
- Zero upfront risk — no licence fee, no implementation fee.
- Savings counted only when they appear in your next import.
- Every figure traceable to its inputs and formula.
Four steps. The last one is ours to earn.
- 01
Tell us what you spend
Upload spend exports, licence lists, headcount and contract dates. CSV or XLSX — we map the columns for you.
- 02
We model the waste
Utilisation, overlap and renewal exposure calculated with transparent, auditable rules. No black boxes.
- 03
You act on the shortlist
Approve, snooze or dismiss each opportunity. Every recommendation arrives with evidence attached.
- 04
You pay only when it lands
Each import is compared to the last, so realised savings are proven before an invoice ever follows.
What the model shows on a €20.4M portfolio
Figures below come from the reference dataset shipped with the platform — a 5,000-employee organisation with 99 software products. Your own numbers replace them the moment you upload.

€20.4M
Annual spend under management
The reference portfolio covers 99 products across a 5,000-employee organisation.
Explore the portfolio€1.63M
Addressable savings identified
Overlaps and idle seats, each with evidence, formula and a confidence level.
See opportunitiesImport over import
Realised savings, tracked
Downsells, seat reductions and eliminated vendors measured between periods.
Open the trackerNo cure. No pay.
You only pay when we deliver a successful result. No result, no fee.
What finance leaders tell us
Illustrative composites based on the reference dataset. Portraits are stock imagery used as decoration, not photographs of named customers.
“For the first time the renewal calendar and the licence data sat in the same place. We walked into three negotiations knowing exactly what we could give up.”
 Marieke de VriesGroup CFOVerstra Industrial · 6,400 employees
“The formulas are visible, so our audit committee accepted the numbers without a separate reconciliation exercise.”
 Daniel OseiVP FinanceNorthbridge Health · 3,100 employees
“We reclaimed idle licences and eliminated two overlapping collaboration tools in one quarter. The tracker showed it in the very next import.”
 Elena FerraraDirector of ProcurementMarlow Retail Group · 8,900 employees
The questions CFOs ask first
What exactly does “no cure, no pay” mean?
Our fee is a share of the savings you actually realise. If we identify nothing you can act on, or nothing lands, there is no fee. Nothing is charged upfront.
How do you prove a saving was real?
Every import is snapshotted. We compare periods line by line and only count reductions that show up in your own data — downsells, seat reductions and eliminated vendors.
Where do the numbers come from?
Your spend exports, licence lists, headcount and contract dates. Each figure shows its inputs, its formula and a confidence level. No estimates are generated by a language model.
What do you need to get started?
A spend export and a licence list are enough for a first review. Contract dates sharpen the renewal picture. You can start from the demo portfolio before uploading anything.